For Apple Silicon Macs
CPU temperature,
right in your menu bar.
ThermPort is a tiny system monitor that puts temperature, CPU, memory, fan, GPU, battery, network, disk, power and Wi‑Fi where you already look. Click any number for a live chart.
14 days free · no account · macOS 14 or later · notarized by Apple
The bar at the top of this page is a live simulation of ThermPort. Click any number; shows the app in Dark Mode.
Ten metrics
Ten numbers. Each with its own panel.
The menu bar shows the headline figure. One click opens the detail. Metrics your Mac doesn't have, like a fan on a MacBook Air, hide themselves.
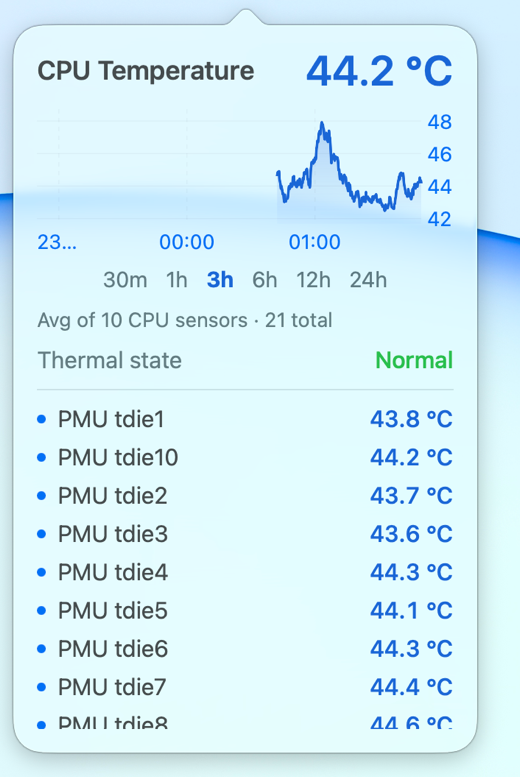
Live simulation. Layout and labels match the panels in the app.
Temperature
Every sensor. One honest number.
Apple Silicon has a dozen or more die sensors. ThermPort averages the CPU-die readings into the figure in your menu bar, then lists each sensor underneath so you can see which core cluster is working.
- PMU tdie sensors on M3 and later; Tp and Te sensors on M1 and M2.
- Thermal-pressure state straight from macOS: Normal, Elevated, Serious, Critical.
- Live history for the last 30 minutes to 24 hours, in °C or °F.
- Read without root and without a kernel extension.
Details
Small app. Considered details.
Colour that means something.
Each value is coloured by the band it falls in, so you read the state before you read the number. Choose one of 15 palettes for every metric at once, or edit any metric's bands by hand.
Told once, when it matters.
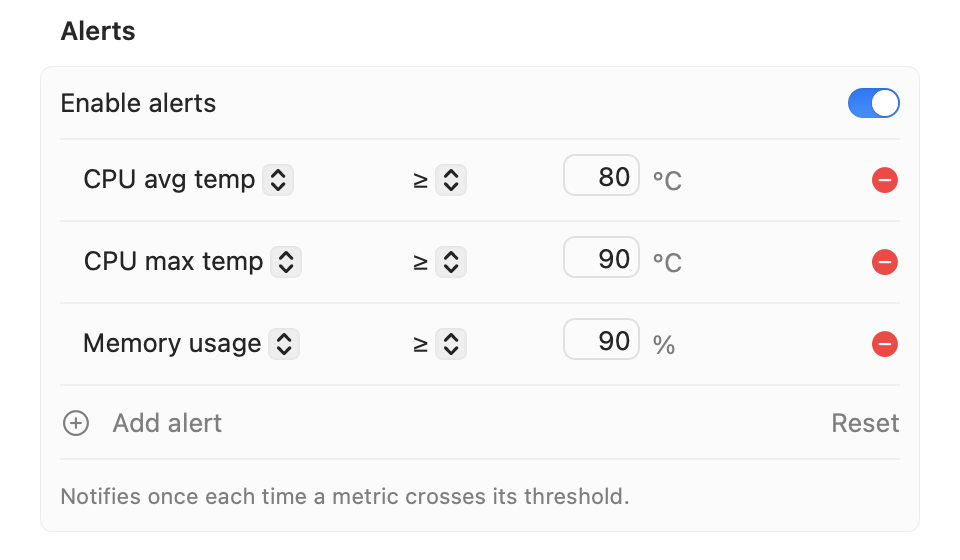
A native macOS notification the moment a metric crosses a line you set. One rule per metric. It fires once per crossing and re-arms only after the value falls back, so hovering at the threshold never nags.

Readable on any wallpaper.
The menu bar is transparent: its text sits right on your wallpaper, and macOS flips that text between black and white as the wallpaper or Dark Mode changes what is behind it. ThermPort watches the bar the same way and adjusts each colour's brightness just far enough to stay readable: same hue, same meaning. A colour that already reads is left exactly as you picked it.
About 20 MB of memory. That's the whole app.
About a seventh of what Stats uses on the same Mac, both idle. 3.6 MB on disk, no daemons, no background helpers, no kernel extension.
≈ 20 MB
≈ 140 MB
≈ 150 MB
Set it up your way.
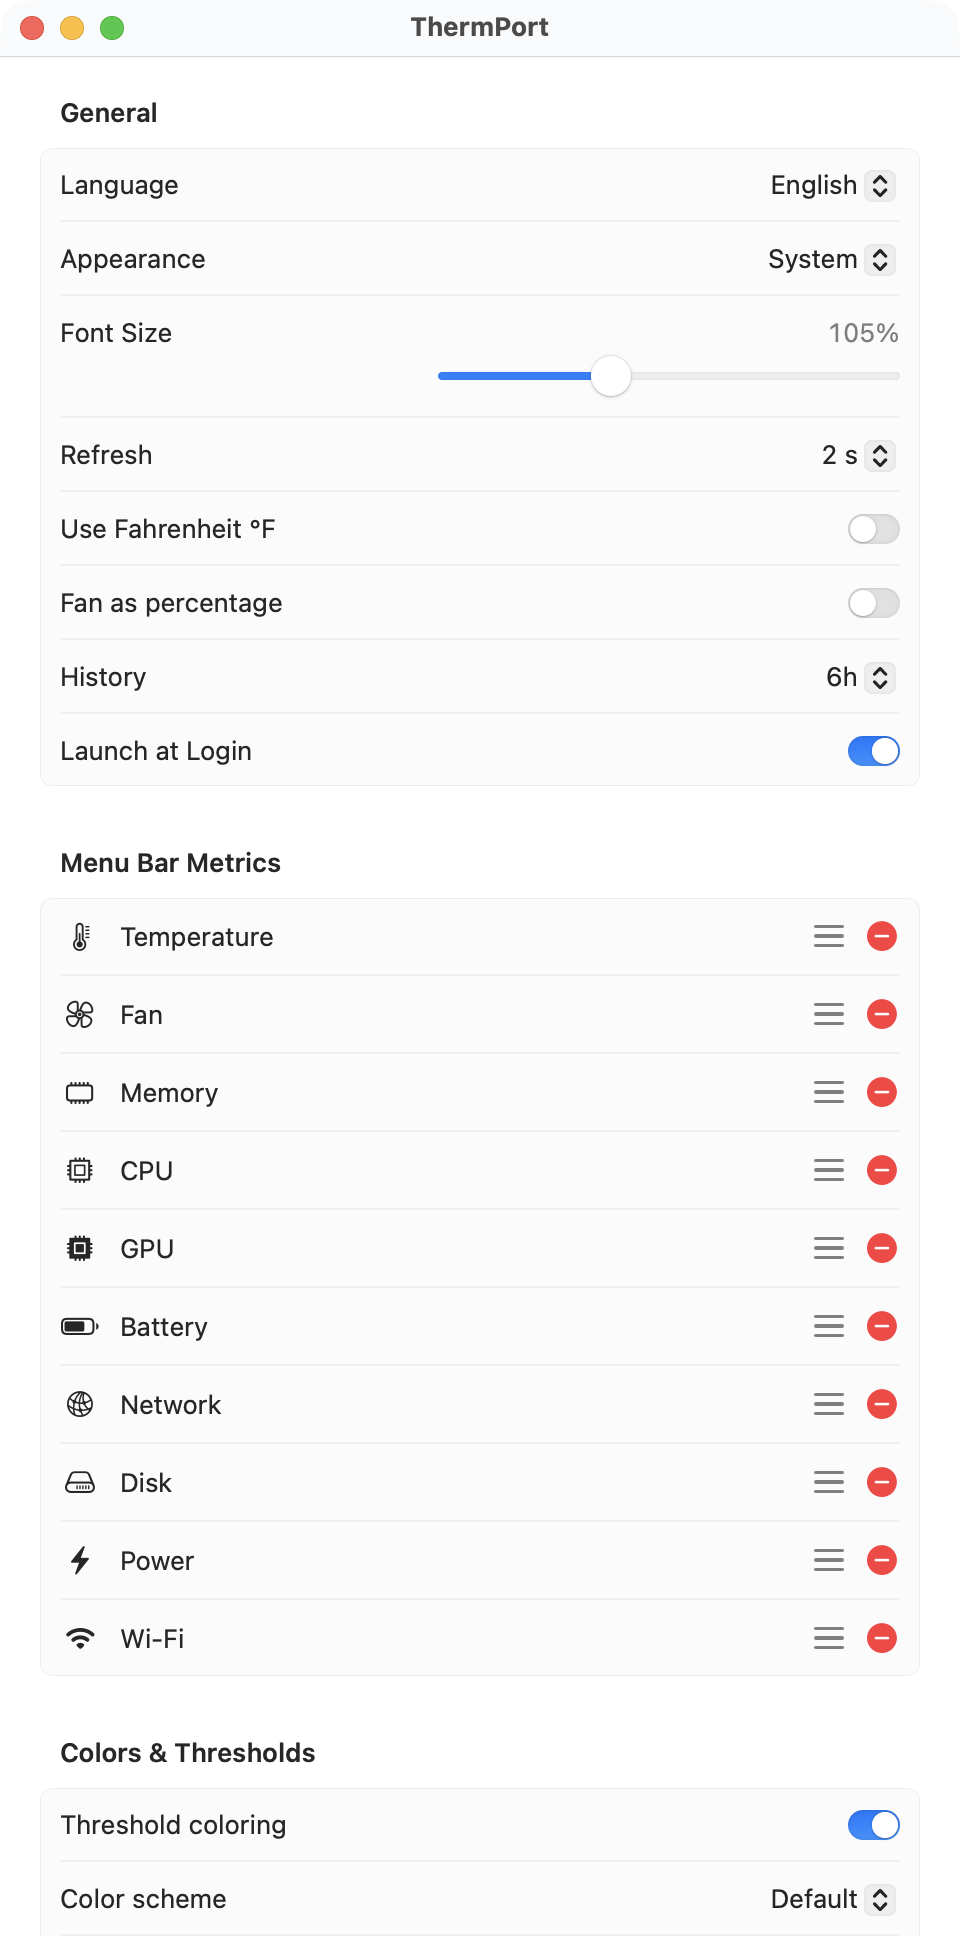
Drag metrics into the order you want and remove the ones you don't. Refresh every 1 to 30 seconds, °C or °F, RPM or percent, text from 80 to 150%, light or dark. ⌘-drag the item anywhere in the menu bar.
Stays on your Mac.
History is a small file in your Library folder. ThermPort goes online only for license and update checks, and for the feedback or reports you choose to send.
The sensors the pros read.
The same sources iStat Menus and TG Pro use, read without root. The every-second paths are written in C; the interface is native AppKit and SwiftUI.
Notarized by Apple. Eighteen languages.
Signed with a Developer ID and checked by Apple's notary service. Download it and double-click: ThermPort moves itself into Applications and opens.
Reports
Reports that explain your machine.
History is written to disk as one-minute averages and kept for about 400 days, across restarts. Pick any period and ThermPort turns it into a two-part report: every metric's curve, then what the Mac was actually doing, ending in a plain-language summary.
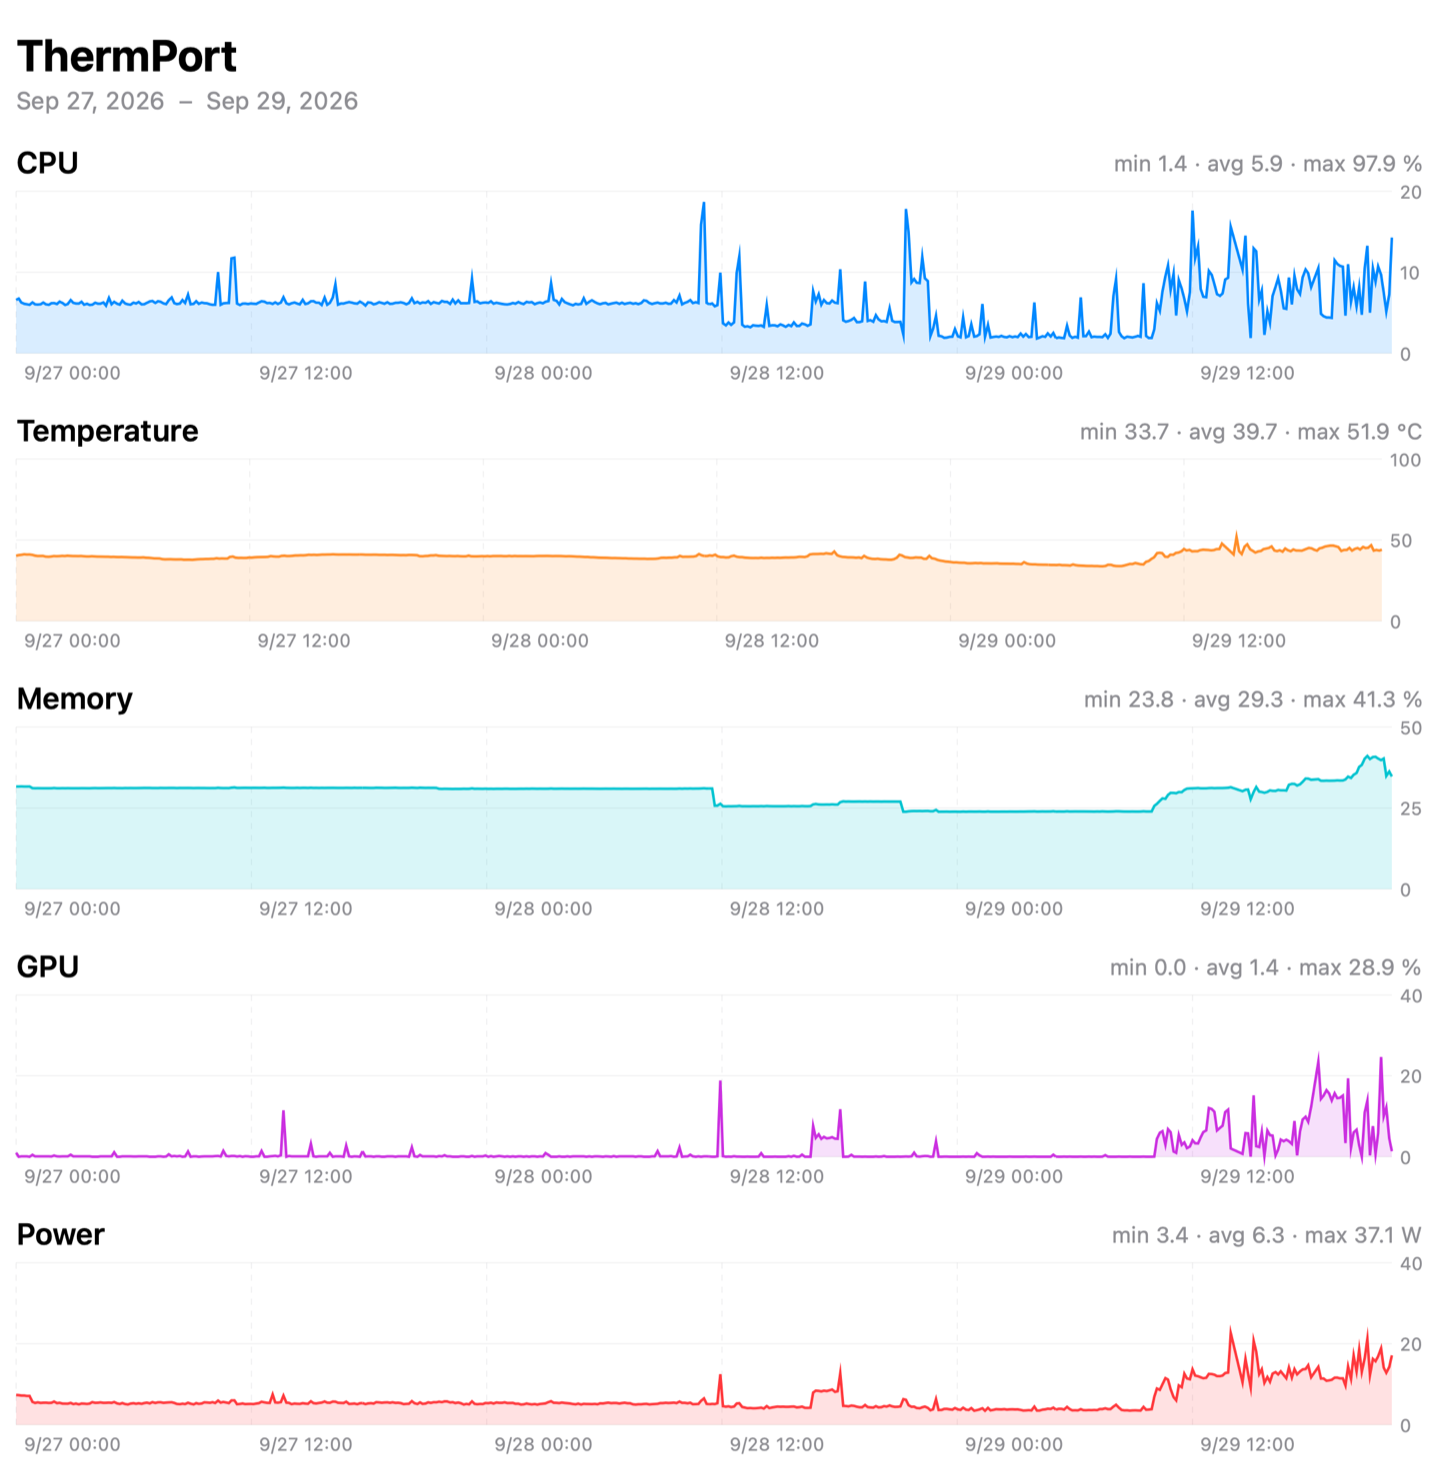


Part one: every metric, min · avg · max.
Today, this week, month, quarter, year, or any custom range. Eleven curves in a fixed order, from CPU and temperature to disk read and write, each with the period's minimum, average and maximum.
Part two: what you were actually doing.
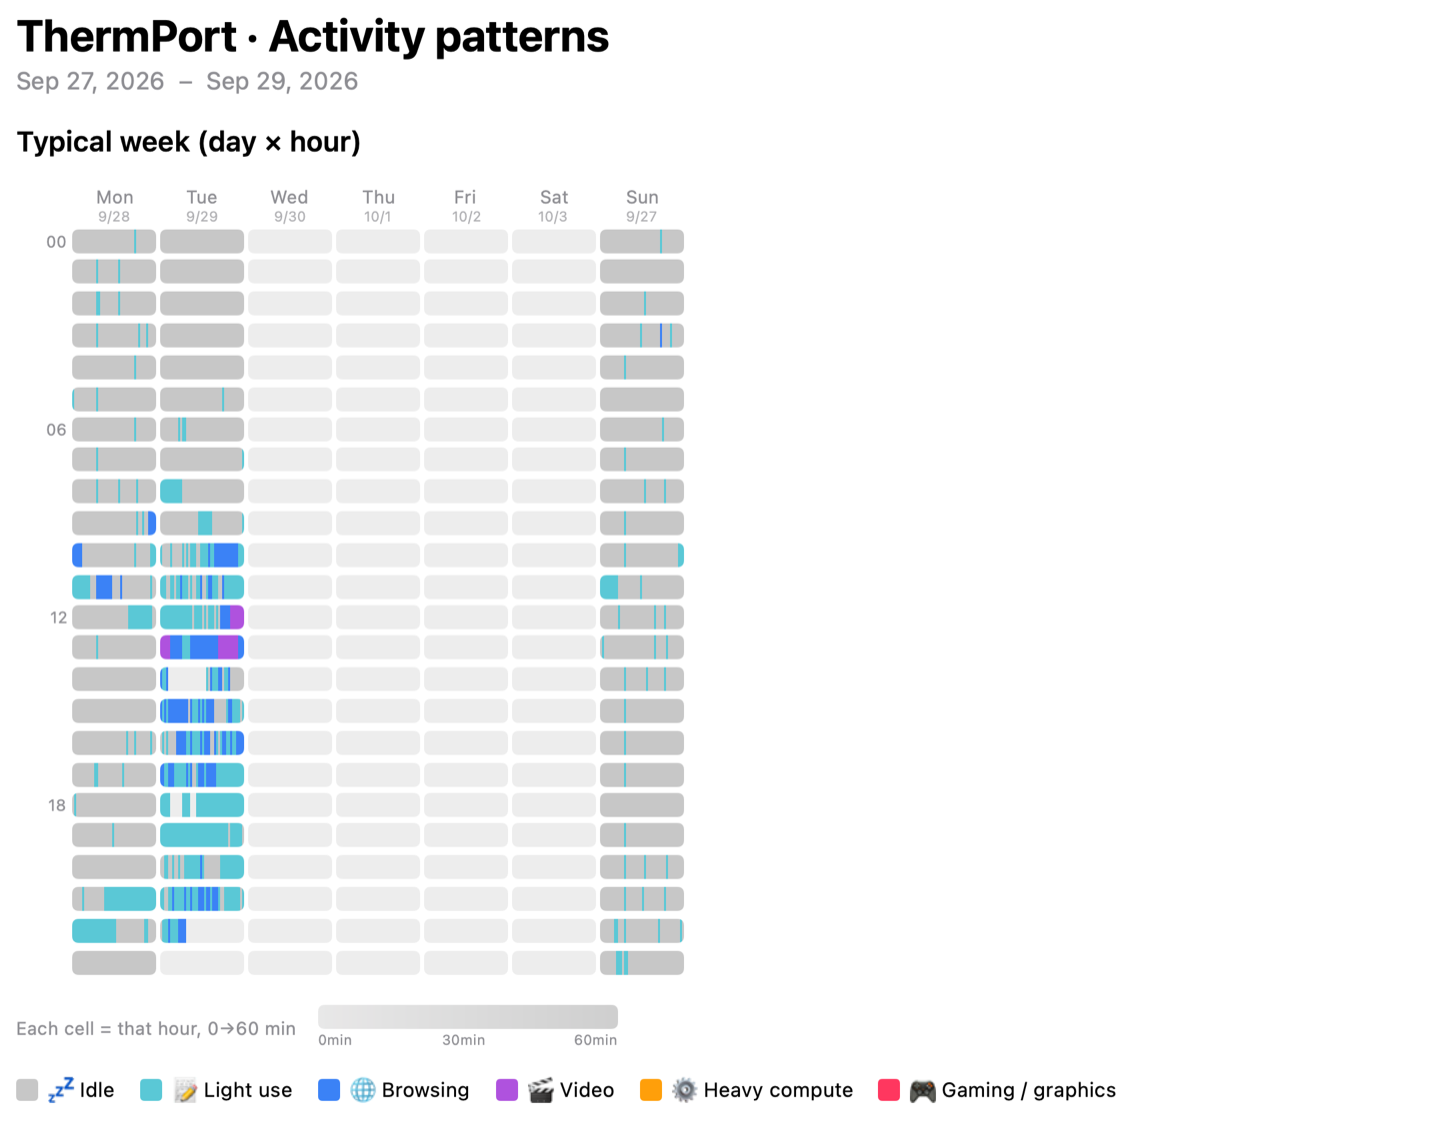
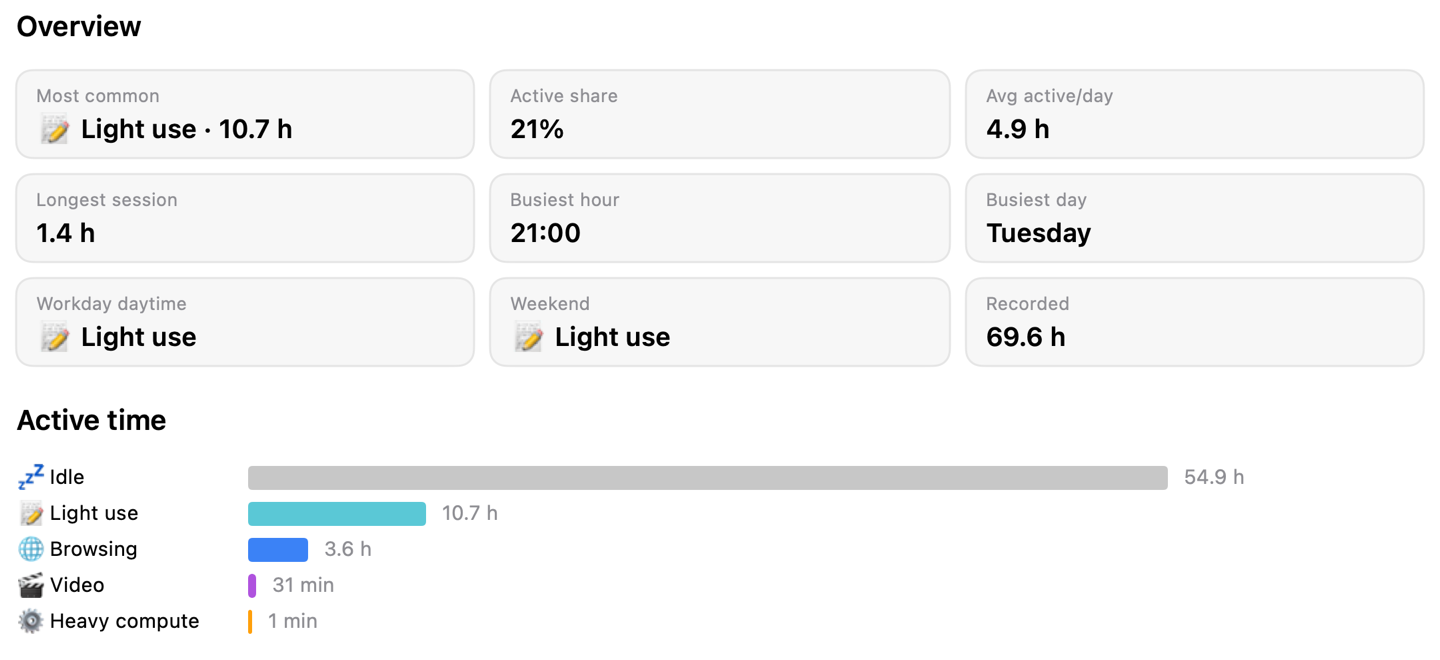
From the load pattern of CPU, GPU and network, ThermPort infers the activity minute by minute: idle, light use, browsing, video, heavy compute, gaming and graphics. It never looks at which apps are open.
- A typical-week heatmap, weekday by hour.
- Most common activity, active hours per day, longest session, busiest hour and day.
- View it as HTML or export a PDF, built locally in about a second.
It ends in sentences, not just charts.
The last section reads the numbers back to you as short nudges. This Mac's report ended with the first line below; the others appear when the numbers call for them.
- Runs warm (peak ~91 °C) — mind ventilation and cooling.
- Long work/study time, ~9.5 h a day on average — balance work and rest.
- You've been up late recently — still active in the small hours.
Or let it land in your inbox.
Turn on auto-email and ThermPort sends the PDF by itself: daily, weekly, monthly or yearly, at the time you choose (21:00 by default), from its own domain so it isn't mistaken for spam. A missed send is caught up on the next launch.
Tech specs
ThermPort 1.1
- Requires
- macOS 14 Sonoma or later on an Apple Silicon Mac (M1 or newer). Intel Macs are not supported.
- Size
- 2.7 MB download, 3.6 MB installed, about 20 MB of memory at idle.
- Metrics
- Temperature, CPU, memory, fan, GPU, battery, network, disk, power, Wi‑Fi. Any combination in the menu bar, in any order.
- Refresh
- 1, 2, 3, 5, 10 or 30 seconds.
- Live history
- 30 minutes to 24 hours in the panels.
- Long-term history
- One-minute averages kept about 400 days for reports, stored locally.
- Colors
- Per-metric threshold bands, 15 palettes, master on/off. Adjusted automatically to stay readable on a light or a dark menu bar.
- Alerts
- Native notifications, one rule per metric, ≥ or ≤, hysteresis.
- Reports
- HTML and PDF, day / week / month / quarter / year / custom, automatic email delivery.
- Languages
- English, Simplified Chinese, Traditional Chinese, Japanese, Korean, Spanish, German, French, Portuguese (Brazil), Italian, Russian, Dutch, Turkish, Polish, Swedish, Indonesian, Vietnamese, Thai.
- Distribution
- Direct download, Developer ID signed and notarized. Not on the Mac App Store, because reading temperature, fan and power needs Apple's private sensor interfaces.
- License
- One-time purchase. One key activates up to 3 Macs. Free upgrades for life.
- Trial
- 14 days, full features, no account. After that the bar shows a lock until a key is entered.
Get ThermPort
Try it for two weeks. Then $6.99, once.
Launch price, regularly $9.99. No subscription. The trial is the full app; buying just removes the time limit.
Free trial
full features
- Every metric, panel, color, alert and report
- No account, no card, no email
- Notarized by Apple
macOS 14 or later, Apple Silicon. Open the disk image and double-click ThermPort: it moves itself into Applications and opens. The 14 days start on first launch.
License Launch price
- Activate on up to 3 of your Macs
- Free upgrades for life
- Key delivered by email in seconds
- Enter it in Settings, or move it to a new Mac any time
Secure checkout by Lemon Squeezy: card, Apple Pay, Google Pay or PayPal. The launch price is applied automatically. Your license key arrives by email within a minute, together with a download link.
Pay once. Free upgrades for life.
ThermPort is in active development and keeps getting better. Our goal is to be the lightest, easiest-to-use temperature monitor on the Mac, and every new version is free for everyone who has bought it.
Using Windows?
A Windows version of ThermPort is in development. Leave your e-mail address and we'll write once, when it ships.
Used for that one message only. Privacy policy
From the app
What people say.
Ratings sent from ThermPort's About panel.
Ratings are submitted from About → Rate ThermPort inside the app.
Good to know
Questions, answered.
Which Macs does it run on?
Any Mac with an Apple Silicon chip, from the M1 onward, running macOS 14 Sonoma or later. It does not run on Intel Macs, because the sensor interfaces are different.
Why isn't it on the Mac App Store?
Reading CPU temperature, fan speed and power draw needs Apple's private sensor interfaces and the SMC, which the App Store sandbox doesn't allow. ThermPort is instead signed with a Developer ID and notarized by Apple, so it opens like any other download.
Does it control the fans?
No. ThermPort is read-only by design. Setting fan speed means writing to the SMC as root through a privileged helper, which is a different kind of app. TG Pro and Macs Fan Control do that well.
What happens when the trial ends?
The menu bar item shows a lock instead of your metrics, and clicking it opens Settings where you can paste a license key. Your history and settings are kept, so everything picks up where it left off.
Where do I find my license key?
In the e-mail Lemon Squeezy sends the moment your payment goes through, and on the order page it links to. Lost it? Enter your e-mail at app.lemonsqueezy.com/my-orders and Lemon Squeezy sends a sign-in link to your past orders. Settings → License in the app has the same link.
Do I have to enter the key again after an update or reinstall?
No. The activation is stored in your Mac's keychain, so updating or reinstalling ThermPort keeps it. Only a different Mac needs the key entered once.
How does the license work?
Buying gives you a key by email. Enter it once in Settings and ThermPort activates that Mac. One key covers up to three Macs you own; deactivate a Mac from its Settings to free up a slot. The app checks the key every few days and keeps working for a month without internet.
What does ThermPort send over the network?
Nothing on its own. It contacts the license server when you activate and for the periodic check, thermport.com when it looks for updates, and the email relay when you send feedback or an emailed report. There is no analytics or telemetry of any kind.
Is a Windows version coming?
A Windows build is in development. Leave your e-mail address in the Using Windows? box under the prices and we will tell you when it ships.

Know your Mac's temperature at a glance.
14 days free · no account · macOS 14 or later, Apple Silicon