Guide
How to check CPU temperature on a Mac (Apple Silicon and Intel)
macOS does not show CPU temperature anywhere. Activity Monitor has tabs for CPU, memory, energy, disk and network, but no temperature, and Apple exposes the chip's thermal sensors only through private interfaces. So every method below is either a Terminal command that shows throttling rather than degrees, or a third-party app that reads the sensors directly. Here is what works in 2026, free options first.
1. Terminal: see whether your Mac is throttling (free, built in)
Open Terminal and run:
pmset -g therm
You get three lines. CPU_Speed_Limit is the one that matters: 100 means the CPU is allowed to run at full speed, anything lower means macOS is slowing it down to control heat. This does not tell you the temperature, but it answers the question most people actually have, which is "is my Mac throttling right now?"
Another built-in command is powermetrics:
sudo powermetrics --samplers smc,thermal -i 1000 -n 1
On Intel Macs this prints the CPU die temperature and fan speed. On Apple Silicon it prints the thermal pressure level (Nominal, Moderate, Heavy and so on) and the fan speed on Macs that have a fan, but no die temperature. That is a limit of what Apple exposes to the command, not a bug.
2. Free apps that read the sensors
- Stats (open source). A menu bar monitor with a sensors module that lists every temperature sensor on the chip. Very configurable, which also means a little setup.
- Hot (open source). A small menu bar app that shows the CPU temperature and whether the CPU is being throttled. Does one thing, does it well.
- Macs Fan Control. Free for monitoring: shows every sensor and fan. The paid Pro version adds custom fan curves.
3. Paid apps
- iStat Menus ($11.99 one-time). The long-running all-in-one monitor: sensors, fans, weather, calendar and much more in the menu bar.
- TG Pro. Focused on temperatures and fans, and the one to get if you want to control fan speed, which the others do not do.
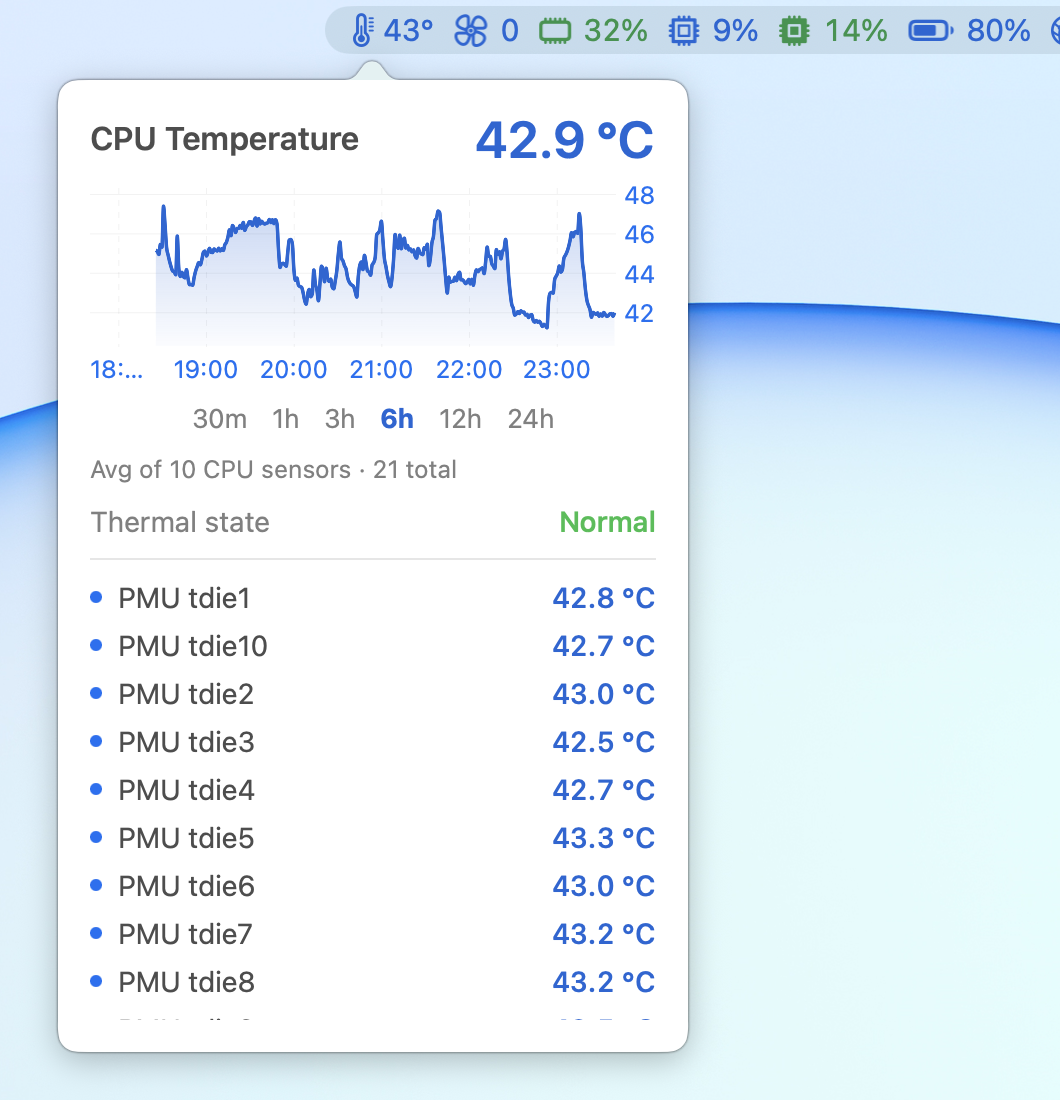
- ThermPort ($9.99 one-time, $6.99 at launch). Our own app, so take this with the obvious grain of salt: it shows the CPU temperature in the menu bar next to CPU, memory, fan, GPU, battery, network, disk, power and Wi‑Fi, each with a live chart, in about 15 MB of memory. It also keeps long-term history and writes reports, which none of the others do.
Which number is "the" CPU temperature?
Apple Silicon chips have a dozen or more thermal sensors: on M3 and later they are named PMU tdie, on M1 and M2 they are Tp and Te. Different apps summarize them differently. Some show the hottest sensor, some show an average of the CPU-die sensors, and the two can differ by 5 to 10 °C under load. When you compare two apps and the numbers disagree, that is usually why. The average is the better indicator of the chip's overall state; the hottest sensor tells you which cluster of cores is working.
Alongside the degrees, pay attention to the thermal pressure state that macOS itself reports: Nominal (or Normal), Fair, Serious, Critical. That is the signal macOS uses to decide whether to slow things down. A Mac that sits at 95 °C while the thermal state says Nominal is fine. A Mac that reports Serious at idle has a problem.
What temperatures are normal?
Roughly: 35 to 45 °C idle, 50 to 70 °C for everyday work, 85 to 100 °C under sustained heavy load such as exporting video or compiling. Apple Silicon is designed to run close to 100 °C under full load and to throttle itself long before any damage is possible. The number to watch is not the peak but whether the temperature comes back down when the load stops. See what a normal CPU temperature is for a MacBook for the details per chip.
Why isn't this built into macOS?
Apple treats the sensor data as an implementation detail and keeps the interfaces private, which is also why none of the apps above are on the Mac App Store: the App Store sandbox does not allow them. Apps that read temperature are distributed directly by their developers, signed with a Developer ID and notarized by Apple.
Frequently asked questions
Does Activity Monitor show CPU temperature?
No. Activity Monitor shows CPU usage, memory, energy, disk and network activity, but macOS has no built-in display of CPU temperature. You need a third-party app that reads the thermal sensors.
Is 90 °C a dangerous CPU temperature for a Mac?
Not by itself. Apple Silicon chips are designed to run near 100 °C under sustained load and throttle automatically to protect themselves. Check the thermal pressure state: if it says Nominal or Fair, the Mac is operating as designed.
Can I see CPU temperature in the Mac menu bar?
Yes, with a third-party menu bar monitor such as Stats, iStat Menus or ThermPort. macOS itself does not offer a menu bar temperature readout.
Why do two apps show different CPU temperatures?
Because the chip has many sensors and apps summarize them differently: some show the hottest sensor, some an average across the CPU die. Under load the two can differ by 5 to 10 °C.

ThermPort puts CPU temperature, fan speed, memory, power and more in your Mac's menu bar in a 15 MB app. 14-day free trial, one-time purchase, Apple Silicon only.
Learn more